When words fall short, how can pictograms bridge the gap between people with different cultural and social backgrounds? How can we design visual tools enabling people with challenges to communicate their own stories? In our artistic research project Pictogram-me we investigate whether it is possible to use pictograms as tools for emotional dialogue.
Pictogram-me is an artistic research project developed at the University of Bergen, Faculty of Art, Music and Design and supported by the Norwegian Artistic Research Programme. The Pictogram-me project aims to experiment and investigate whether pictograms, which are normally accepted as simple and not very flexible visual messages, can express more complex social messages. We aim to highlight the experiences of different groups who have a challenging existence. We have chosen these groups of people, who have especially complex daily lives, as our case because for them communication can represent an enormous social and emotional challenge. Researching and communicating their stories represents a challenge for designers, our aim is to encourage increased attention and empathy for those who have a difficult daily life.

The project is based on research through design, which means that making is one of the most important methods when seeking new insight and experiences (Bergdorff 2006). In this project, we have cooperated with people with challenges, by visiting and interviewing them and their interest groups, if they have one, and collected their stories. We cannot claim to comprehend the diversity and the extent of the challenges some of us have. We can all feel under-privileged or have a difficult day, but we use ’people with challenges’ as a generic term for individuals or groups of individuals who, for longer periods of time, face challenges in life and society. There can be many different types of challenges, related to being unemployed, in poverty, a victim of crime, a prostitute, an immigrant, a drug addict, elderly, a sexual deviant, or having lifestyle complaints, physical or sensory disabilities or being mentally challenged.
When giving something in return to our ’people with challenges’ participants became our inspiration for seeking an ethically balanced dialogue, we focused on developing tools for visual dialogue to enable others to tell and communicate their own stories directly, and on tools to record their stories. Our experiments led to the development of the PictoTheatre.
1. Why pictograms?
The Pictogram-me1 project is based upon design for social innovation and inspired by Isotype, a symbol system developed by Otto Neurath to explain and illustrate social and economic issues to the general public in the 1920’s. His vision was: ’Words divide, pictures unite.’ (Annik & Bruinsma 2010). One question explored in this project is whether Isotype’s philosophy that every picture tells a story, can be revitalized using pictograms as tools for emotional dialogue. Pictograms are normally accepted as simple and not very flexible visual messages, and often used because recognizing an image is easier than reading text (Norman 1988). We are surrounded by thousands of pictograms each day such as the friendly couple on the doors of public toilets, the icons on your smart phones and computers, and on weather maps and street signs. They are there to inform or warn, or sometimes just to be decorative. Pictograms’ popularity has been encouraged by their ability to transfer information across the borders of language effortlessly and impartially. But, pictograms are accepted as simple, fixed and universal visual messages that are designed for maximum functionality to convey information, not emotion. How then could the Pictogram-me project use pictograms to express more emotional and complex visual messages and create empathy?
1 The Pictogram-me project has a Website: Pictogram-me.com, Instagram #Pictogram_me for interaction with the public. People can contribute by share personal drawwings, or telling their stories by using the pictograms developed. They can also download pictograms and use for free.
In Art and Visual Perception – A Psychology of the Creative Eye, Rudolph Arnheim explains about the recognition of form 'Simply put, the physical shape of an object is determined by its boundaries, like the rectangular edge of a piece of paper.' (Arnheim, 1954, p. 74). Scott McCloud talks about amplification through simplification, he pertains that people respond to cartoons as much as or more than to a realistic image. The same could be said for pictograms. “By stripping down an image to its essential ’meaning’ an artist can amplify that meaning in a way that realistic art can’t.” (McCloud, 1993, p. 30). Egyptians used orthogonal projection, because it was faster and easier for their minds to recognize. Also, Neurath was inspired by hieroglyphics as they made language pictorial, and his development of the pictogram standards in Isotype was influenced by their communicative clarity. Therefore, we summarize that pictograms, and their simple outlined forms, have the potential to communicate better than reality-true illustrations.
2. Process
At the start of the project in 2011-13 our initial tests gave us very limited results: Our students based their collection of data on posters announcing meeting places, invitations, project explanation cards, facilitating workshops with drawing tools for drawing together and interviews.2 There exists a lot of literature about how to collect various data focusing upon individual stories, and for example sociologists have developed methods of show to direct “life story interviews” (Dowling in Tiller 2004, p. 237-240, Wideberg in Album, Hansen and Widerberg 2010, p. 220-225). Different public organizations and universities have developed toolkits that address how to involve people from the initiation of a design project to its implementation, and share their methods and resources online.
2 The collection of material for the research project has been based upon the involvement of Visual communication students at the academy became the Faculty of Art, Music and Design at the University of Bergen (until 2017 the Bergen Academy of Art and Design), and from workshops and exhibitions, and visitors and volunteers from our theme groups—people with challenges. Between 2011–2017 the project has held eight methodology and pictogram development courses, involving users through workshops and interviews, held two exhibitions—one of them including five workshops, one international seminar and over twenty presentations for design professionals.
Nevertheless, it was not easy to engage the participants in dialogue and sketching. When they were visiting the cafes and offices, where we chose to meet them, they were seeking a warm shelter and privacy and not dialogue with strangers. Our results were collected from observances and our own interpretation of another’s situation, we realized that we had to look for other methods if we wanted to collect more honest stories. We had to go out and meet them in their daily surroundings when they were not seeking food and comfort, and we recognized the need to further develop our visual tools. In 2014, we were impelled to change our focus from developing a tool to support our interviews—to creating a tool that would enable our theme groups to tell their stories themselves. The project based its further research upon Design for social innovation and Participatory design thinking.3 These fields of design have their roots in action research, which is a form for research involving the participants in defining and solving problems. Empowerment of participants is essential, and is highly relevant when designing for empathy. Inclusive design and people-centred design processes are said to be effective as development processes, because users can play a leading role in defining issues and helping to focus direction, therefor there has been a shift from designing for users, to designing with users, where the user also becomes a co-creator (Fuad-Luke 2009, Eikhaug 2010).
3 The Pictogram-me project has a Website: Pictogram-me.com, Instagram #Pictogram_me for interaction with the public. People can contribute by share personal drawwings, or telling their stories by using the pictograms developed. They can also download pictograms and use for free.

This shift has been paralleled with debates about the social dimensions of design. Even it appears that there is agreement on the ethical and practical advantages of participatory design approaches, the subject itself is also debated (Bjögvinsson, Ehn and Hillgren, 2012). In the Pictogram-me project participants became our co-designers,4 we included our participants both in the design of the new visual tools and in testing them. The groups of people with challenges we have cooperated with are one group of elderly, two groups of homeless or beggars, several groups of drug-misusers or people with earlier user experience, a group of refugees, and more recently people with dementia. We have also had the help and support of the Megafon Street magazine 2011, The Church City Mission 2011, Margit Tanners Remem-brance home for the elderly 2012, Bakkegaten Care and Housing Community 2012, Arna Active 2015−16, Vartun Care and Housing Community 2015−16 and Bergen Clinics 2015−16. Our dialogues with people with challenges have been based upon anonymity, trust and empathy.
4 In the mid-1940s the American psychologist Kurt Lewin (Lewin in Masters, 1995, p. 1) argued that to understand and change social conditions, you needed to include those who know and live with the conditions.
Stories have been told that affect us, but we have had no experience of unpleasant behaviour, quite the opposite, we have received only positive responses; especially our drug misusers and immigrants were thankful that someone wanted to hear and visualize their stories. There have been ethical challenges in our research, especially in the way our meetings with our theme groups affected them. We experienced that some of the homeless we visited, over a period of some weeks, looked forward to our visits. One gentleman started showering because he wanted to be more 'presentable' and another said he had never looked forward to talking so much. But what happened to them after our research time was over? We received so much from them; in return, we had shown our interest and concern, then to totally disappear after the project time was over. Giving something in return to our participants also became our inspiration for seeking an ethically balanced dialogue. We focused on developing visual tools to enable others to tell and communicate their own stories directly, and on tools to record their stories. We tested apps, clay modelling, interpretive dance, image projections, kinetic pictograms tracking body movement, magnet pictograms, books to comment in, tablecloths to draw on, pictogram figures to play with, all with photo or print documentation amongst others. These experiments led to the development of the PictoTheatre which we will explain later as one of our 'results'.
3. Similar projects
Two examples of projects using pictograms to express statements and attitudes are Pussy Galore and Olympukes. In the 1995 Pussy Galore typeface was created by the Women’s Design and Research Unit (Teal Triggs, Liz McQuiston, and Sian Cook). The pictograms were designed to help explore the roots of misconceptions about women inspired by the jargon of Western culture. Nine years later Olympukes, 52 satirical pictograms designed by Jonathan Barnbrook and Marcus McCallion, was developed as a comment on the commercialization of the Summer Olympics in 2004. These two reference projects were most relevant when we originally planned the Pictogram-me project, in that we the designers would visually translate our parti-cipants stories. But as the project developed we redirected our focus to investigating projects that enabled the participants themselves to tell their stories. Blissymbolics were developed by Charles K. Bliss (1897−1985).
Bliss originally wanted to create an easy-to-learn international auxiliary language to allow communication between people who do not speak the same language. They were conceived as an ideo- or pictographic writing system consisting of several hundred basic symbols. Today over 4,000 symbols exist. In the 1970−80s Blissymbolics was used by people, with severe difficulties in speaking, to communicate without speech. It represented the start of 'augmentative and alternative communication'. The organization ISAAC International Society for Augmentative and Alternative Communication, founded in 1983) seeks to improve opportunities for people with serious communi-cation difficulties. The organization works to promote research and development of alternative communication. In one case, they used pictograms to create a tool to help people speak about difficult subjects, like violence. In 2012, they tested 29 pictograms to find out how people actually read them (Torgny and Kristensen, 2012, p.8, translated from Swedish). The organization divided the pictograms into three groups:
- Images that are read directly.
- Images that are understood when they have been explained and linked to an already known concept.
- Abstract images that must be learned.
Visual tools have for many years been used to enhance conversation with children and with people with psychological challenges, and dolls have been used in conversations with children to address difficult subjects. There are many examples of picture languages and online resources, one, the KAT-box was originally developed in Denmark for children with Asperger’s Syndrome in a collaboration between Dr. Tony Attwood, psychologist Kirsten Callesen and psychologist Annette Moller Nielsen. In this toolkit, you amongst other tools, find a kind of thermometer, divided into intervals from zero to ten, where the user can put faces and other visual symbols to judge the intensity of feelings, thoughts, experiences, and interests in a concrete way. Migrantas5 are designers aiming to make visible the thoughts and feelings of those who have left their own country, using pictograms as a visual language of migrants. In 2014, we had the opportunity to arrange a workshop in Bergen with Migrantas. This workshop gave us new insights as to what people themselves defined as challenges. Some of the drawings communicated feelings like loneliness, and these drawings were further developed into pictograms.
5 Marula Di Como, a graphic artist and Florencia Young a graphic designer, migrated to Berlin from Buenos Aries in 2002 where they initiated the collective Migrantas in 2005. Migrantas’s aim is to exhibit the thoughts and feelings of those of whom have left their homes and countries and moved to new homes and countries. Migrantas organizes workshops with migrants to reflect together on issues of migration. Migrants from very different national, cultural and social backgrounds, exchange their experiences and express these in drawings. Migrantas analyses the key elements and common themes from the drawings and translates these into pictograms.
The pictogram results were exhibited beside the original drawings in Bergen 2014. Unlike Migrantas we do not want to translate the drawings that the participants make into pictograms. We want the participants to visually tell the stories themselves, we are not making pictograms that tell stories—we are making pictograms to be used as tools to tell stories with. To make our tools easy to understand and use, our pictograms had to be general and recognizable intuitively—we do not want to have to explain the pictograms (ISAACs Group 1: Images that are read directly) as you have to with Blissymbolics (ISAACs Group 2 and 3). If we could minimize the number of pictograms to use in the tool then they would be easier to find quickly and not delay or halt the conversation. We believed that their simplicity could be an advantage for interpretation, seeing as they could have different meanings in different contexts—e.g. a syringe could symbolize medicine, or it could symbolize drugs, or it could symbolize small doses taken or given…

Our project, as with the KAT-box project, is that we juxtaposing pictograms to tell a story. Both projects are also designed as aids to help difficult conversations, not to replace the conversation. What is different with our project is that we use multiple images or pictograms in an illustration or together with other pictograms.
A pictogram of a man becomes me—a pictogram of a woman Mother—add a heart and a house and the story becomes me and my mother in our loving home, and with a background of a sunny day. The total picture is put into a context and symbolically strengthened.
4. Results
At one of our project exhibitions, in Bergen in 2014, we presented a new digital tool we had designed, the ’PictoBooth’. The PictoBooth is the equivalent of a Photo Booth; using Kinect technology6, your body language and gestures are registered and translated into real live pictograms. With a countdown time to freeze your own pictogram with a chosen title and the PictoBooth automatically prints a copy for you. It encourages participants to act and pose to make their own pictograms.The intent was to be a co-creator of pictograms, and to raise self-awareness of body language. At the exhibition, it received much attention. We reflected that by using visual aids as captivation and entertainment, they were an icebreaker to attract people to participate in storytelling, and that it gave us the possibility to give something in return: to tell stories on screen and get an immediate printout.
6 Kinect is a live motion sensing input device released for programmers by Microsoft in 2011, it is a user interface that can use gestures as commands as the Kinect technology recognizes the physical points and joints on the body.
We had already experienced the challenge of working with people with varying ’daily form’, who were most difficult to make appointments with and to facilitate work-shops for. And as we had realized that we had to go out and meet our theme groups in their milieu, we planned to further develop the PictoBooth to be a physically moveable tool with additional pictograms that you could drag and drop into the main picture to encourage more complex storytelling. But, in the meantime in 2015, we developed another tool: The PictoTheatre. Two separate occurrences were a breakthrough for the project and led to the invention of the PictoTheatre. Firstly, we were contacted by Bergen clinics, who invited us to contribute at a conference about drug related care. Months before the conference, we met representatives from the Bergen Clinics and other related organisations, to discuss the possibility of testing pictographic tools in drug related care.
In the meeting, we discussed how spoken or written language could make the user feel excluded, and how a formal bureaucratic language could make them feel like outsiders. We concluded that it was important to develop a visual language, so that when invited to a dialogue with dignity and respect the users could feel equal and competent. The Bergen Clinics’ needs were parallel to our project’s aims, and therefore we could test tools with them. After the meeting, we were reminded of a book one of the participants showed us, a fiction book, with personal photos and notes added, made as a gift for a child whose mother had passed away. The book was made to help the child keep memories of her/his mother and to be reminded of her positive qualities. How can you use an existing story and introduce visual information to it to tell a person’s life story? We had an idea for an exhibition, The books we read, we also designed tablecloths illustrated with urban and rural scenes. By placing pictograms into the scenes, they became actors for telling stories and tools for conversations.
After we had made prototypes to test these ideas, we discovered that although you can learn a lot about another person by having a conversation about the books they read, we also experienced that the participants were intimidated. Some were shy because they preferred to read comics, for others it reminded them of the problems of doing homework. The tablecloths worked as a good conversation starter, but the results and the stories felt rather flat and two dimensional. The tablecloths also introduced us to the idea of using cut-out pictograms as ’actors’, not only as moveable human figures but, also as support pictograms, houses, beds, hearts, rain, feelings, nature and so on.
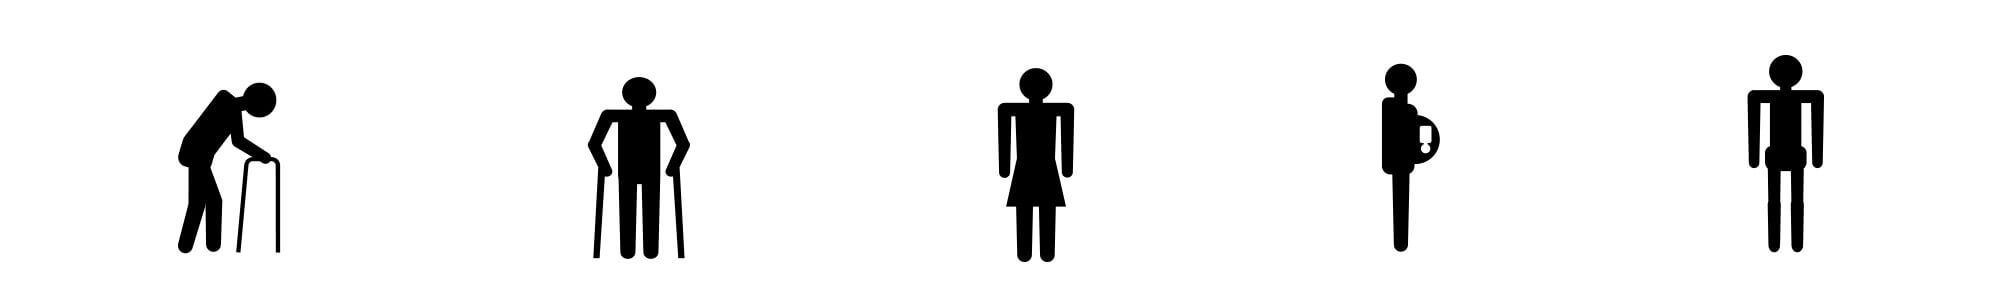
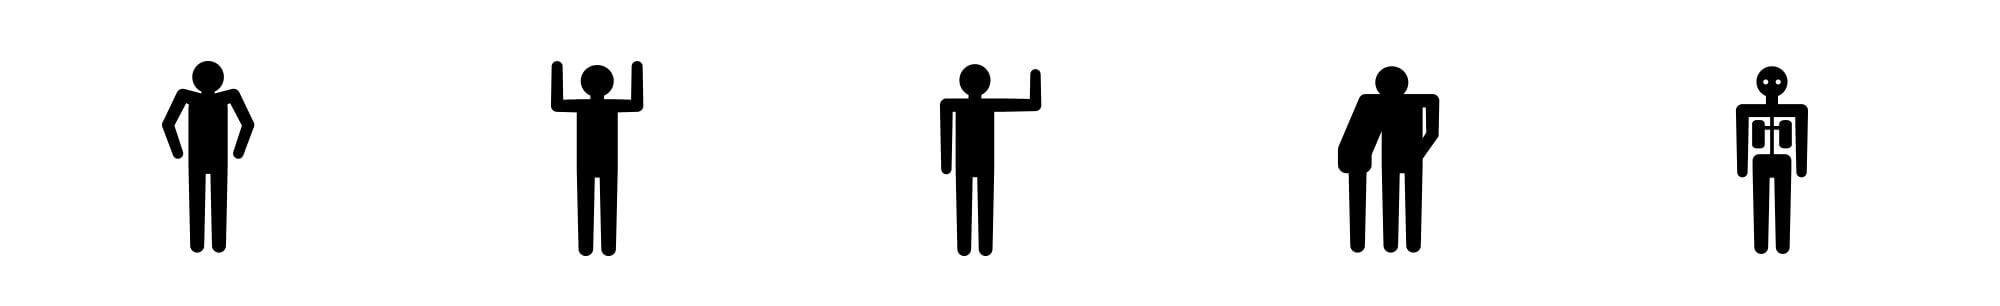
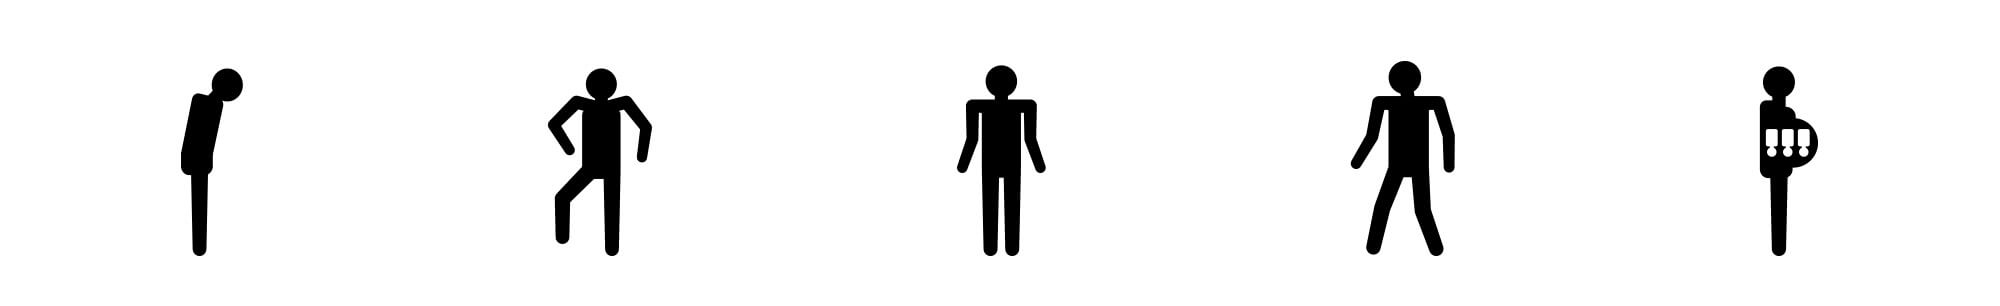
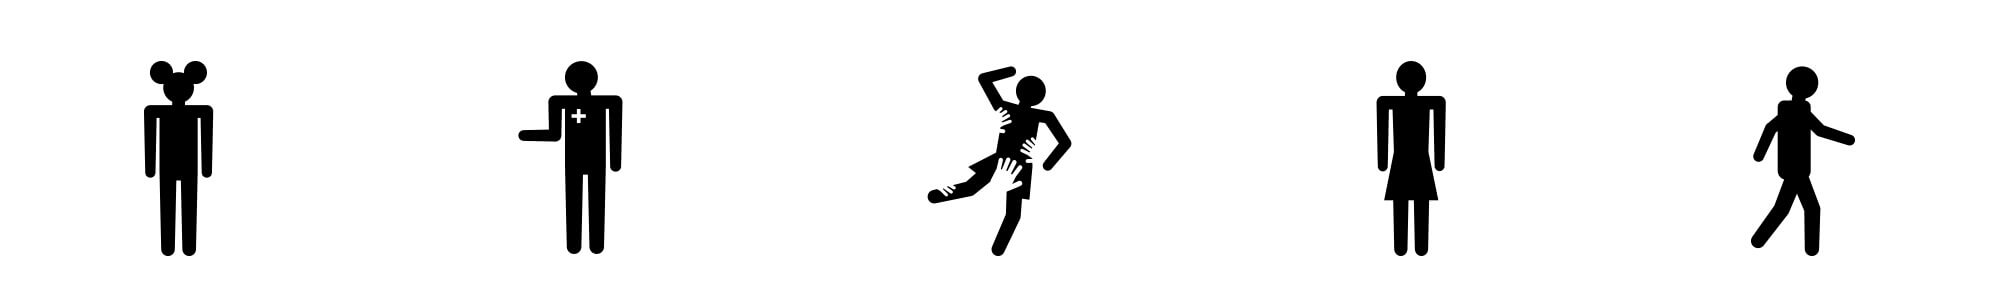
It was important for us that the pictograms we developed as conservation tools were in what ISAAC calls its Group 1: Images that are read directly. We made a collection of pictograms where the design of the human figures is based upon Kinect technology. By utilizing the technologies recognition of physical points and joints on the body we redefine these mapping points to the joints of our human pictograms. The support pictograms were chosen from the most familiar images from different pictographic font families.
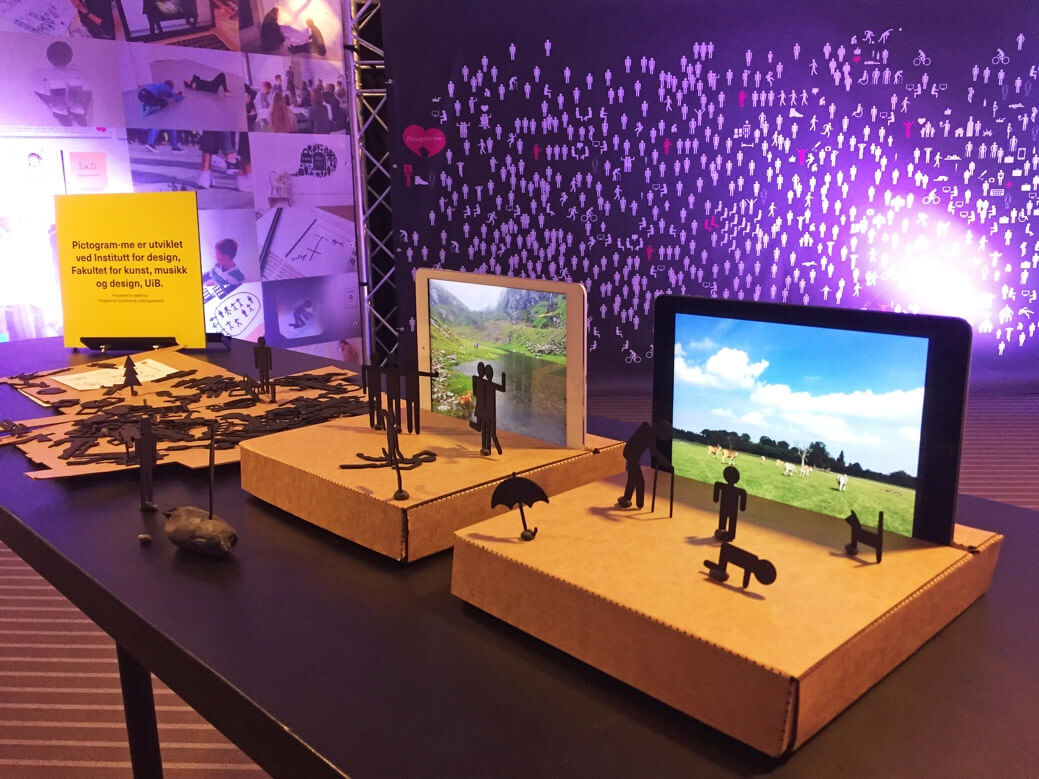
The second occurrence that changed the project was not planned. While working with the cut-out pictogram figures, we rested a figure in front of the computer screen. Looking at the pictogram in front of the screen, we realized the possibilities of combining both the physical and digital worlds. This initiated the development of a small and very simple mobile theatre. The theatre was built around an iPad which created a back-drop with a choice of images, a cardboard box held the iPad in place and created a ’stage’ in front of it, and the cut-out pictograms became actors and properties that could move on the three-dimensional stage creating a small-scale theatre. When we tested an early prototype, one of the participants told us how he had to present his life story over and over again to different social workers. We saw the need for a tool that not only could be used in conversations, but also could record the illustrated story. As the PictoTheatre is so compact it is also easy to photograph and record the stories for future use. In 2015−16 the PictoTheatre was discussed and tested with the help of Bergen Clinics and test groups of people with experience from drug misuse (our co-designers), it was simplified for flexibility7. The number of pictograms in the toolkit should not be too large, unlike the projects Blissymbolics, which has over 4,000, our pictogram languagedoes not need to be so specific. We started with 50 and made over 200 ’general’ pictograms, the testing indicated that the tool becomes too complicated if we include more than 100 pictograms as it becomes more difficult to find the pictogram you are searching for amongst all the others.
7 In Pictogram-me participants can be referred to as co-designers. In an article published in the 1960s Sherry Arnstein (1969) describes how citizens can be involved or excluded from development processes. In his 'Ladder of citizen participation', Arnstein points at eight different degrees of involving, and relate this to power: “There is a critical difference between going through the empty ritual of participation and having the real power needed to affect the outcome of the process” (Arnstein, 1969, p. 2). The top level, citizen control, has much in common with co-design.
The pictograms should not be too specific as this can limit their flexibility and hinders the flow of storytelling. With only 100 pictograms and one box/theatre stage (approximately 20 x 20 cm) we were now able to produce the toolkit at low cost, if the iPad and camera are provided by the users. In 2016, to investigate how the Picto Theatre prototype worked in conversation with people from different cultures and challenged by learning the Norwegian language we took the toolkit to an event where refugees could meet locals. We tested the PictoTheatre with, amongst others, three young men from Syria, who had only been living in Norway for a few months. Their Norwegian language skills were still at an early stage. We soon experienced that they needed additional pictograms to the ones included in our toolkit prototype. New pictograms or pictograms with extended meaning were easy to make there and then, using paper and scissors. We added images from the internet for the stage backdrop, and then the refugees played around with pictograms on the stage, visually telling us about their journeys from Syria to Norway, about their education and work, and what they had left at home. To contribute with new pictograms and accessories made the participants proud, and gave them the opportunity to use their craft skills and work together. It also gave us the insight that the toolkit should be a combination of both a finished product and a ’do-it-yourself’ concept. When the user creates pictograms and the stories themselves, then conversation also becomes easier and their stories come to life.
5. Conclusion
We introduced the use of pictograms in this article with our inspiration from Neurath’s Isotype and his philosophy that pictures unite. We have asked ourselves how we could revitalize his ideology and further develop it, through our research into the possibilities to use pictograms as tools for emotional dialogue and/or bridge the gap between people with different cultural and social backgrounds by developing visual tools enabling people to tell their own stories. Our findings show that pictograms can be made into powerful tools for emotional dialogue. The project has led to the development of a pictographic tool, the Picto-Theatre, to empower our participants to visualize their stories. We have re-invented the use of pictograms as tools—based on Neurath’s ideology to democratize communication by making information accessible for the illiterate through pictographic visualization. More explicitly, our contribution in relation to Neurath’s work is not only making information accessible to challenged groups but empowering people with challenges to communicate between themselves or with others their own stories and statements. We have created a new tool for visual dialogue. Our experience is that the use of pictograms is a language that has the ability to empower challenged groups to tell their stories, because pictograms are a language that people universally feel familiar with and understand, they are therefore very comfortable expressing themselves with them. The simplicity of the pictographic language can disguise its depth, although its basic forms are liberated from carrying specific burdens of meaning or channelling a limited or narrowly defined meaning a set of the simplest of pictograms can be used to tell stories with a variety of interpretations about the complexity of the real world.
Our explanation is that a pictogram is like a picture; it can tell subjective and emotional stories, rather than having to negotiate challenges and personal traumas through the verbal narrative only. Pictograms are also neutral and traditionally impersonal and objective, which makes it easier for our theme representatives to use them to tell stories that are very sensitive and personal; stories that can be told more easily because of the pictograms anonymity and simultaneous objectivity and subjectivity. When exposing the pictographic visualizations, our subjects may remain anonymous, which is why pictograms are an excellent tool for telling emotional stories. Our observations from our research are firstly, that our participants have shown a surprising affinity towards our pictograms, which are familiar and recognizable from signage and interfaces that surround us daily. Pictograms are often presented as our helpers presenting information, directing or warning us, they are designed for maximum familiarity. Secondly that we believe that the pictogram’s neutrality is its strength in this emotional context. You can interpret the pictograms and the pictographic stories with your own associations, and this can arouse emotions and thus empathy. Talking with pictures may help both the storyteller and the listener to maintain a distance to the stories that could otherwise affect us too strongly, or affect us in a way that is not helpful. Thirdly, it was easier than anticipated to encourage empathy through the use of the PictoTheatre. The Pictographic stories could give us insight into another’s life and how the participant, with his background and history, experienced his situation. It can be used as a tool to facilitate conversation, telling and listening, and thereby to augment solidarity and shared feelings between the participant and the listener. Finally, that the PictoTheatre’s strength lies in the fact that everyone can understand it; it is a universal language.
With the PictoTheatre people can communicate to one another their infinitely varied and complex experiences, and difficult conversations can be made easier when you also have the ability to ’talk with your hands’. The PictoTheatre is presently being tested by design students in health care working with people with dementia. Researching how to improve communication between patient and families and patient and nurses. We are now awaiting and looking forward to their findings, but preliminary feedback was the need for more pictograms to enable the patients to help recall memories or moments, for example ’dancing cheek to cheek’. We have also received questions about, and interest in, testing of and usage of the PictoTheatre from different public organizations working with groups of refugees, foreign prostitutes, and drug addicts. There are challenges for the future of the PictoTheatre; it has developed from being an Artistic Research Project to a tool which should be offered into professional service. The PictoTheatre can make a difficult conversation into a playful workshop, it can be a therapeutic tool. In our judgement and after our design research, stories of bad experiences and tragedies with this facilitating tool, should be told in the company of professional therapists. As our research and testing demonstrates, stories can become even stronger when they are visualized, and the tool should be used with care. The PictoTheatre is now finalizing the prototyping phase in preparation for professional physical production, and, we hope, mass-production. The blueprints will be shared online, enabling anyone to make a version of the theatre themselves.
References
- Annink, E. & Bruinsma, M. (2008). Lovely language. Words divide pictures unite. Rotterdam: Veenman.
- Arnheim, R. (1954, 1974). Art and Visual Perception - A Psychology of the Creative Eye. London: University of California Press, Ltd.
- Arnstein, S. R. (1969). A Ladder of Citizen Participation, JAIP, Vol. 35, No. 4, July 1969, p.216–224.
- Bergdorff, H. (2006). The debate on Research in the Arts. Sensuous Knowledge series. Bergen Academy of Art and Design.
- Booth, A. J. (2012). Pictogram-me – A visualization of a difficult life - Project description.
- Björgvinsson, E., Ehn P. & Hillgren P. A. (2010). Participatory design and ´democratizing innovation ´. MEDEA - Collaborative Media Institute Malmö University. Published in PDC ´10 Proceedings of the 11th Biennial Participatory Design Conference, Sydney, Australia, p. 41–50.
- Dowlin, F. (2004, 2011). Aksjonsforskning og livshistorier in Tiller, Tom (ed). Aksjonsforskning i skole og utdanning. Kristiansand: Norwegian Academic press, p. 231–248.
- Dreyfuss, H. (1972/1984). The Symbol Sourcebook: An Authoritative Guide to International Graphic Symbols. New York: John Wiley & Sons
- Eikhaug, O. (ed). (2010). Innovating with people. The business of inclusive design. Oslo: Norsk Designråd.
- Fuad-Luke, A. (2009). Designing together: The power of ´We Think´, ´We Design´, ´We make´ in Design activism: Beautiful strangeness for a sustainable world. London: Eartscan, p. 141-166.
- Krznaric, R. (2014). Empathy: Why it matters, and how to get it. Penguin / Random House Group
- Mach. E. (1867). Why has the man two eyes? a popular lecture, printed 2014 Cambridge: Cambridge University Press
- Masters, J. (1995). The history of action research in Hughes (red.) Action Research Electronic Reader, The University of Sydney. Available at: http:/www.behs.cchs.usyd.edu.au/arow/Reader/ masters.htm (Retrieved August 5, 2012).
- McCloud, S. (1993). Understanding Comics, Kitchen Sink Press, Northampton.
- McLuhan, M. (1964). Understanding Media: The Extensions of Man. New York: McGraw-Hill
- Norman, D. A. (1988, 2002). The Design of Everyday Things. New York: Basic Books
- Neurath, O. (1937). International picture language / Internationale Bildesrpache. Department of Typography & Graphic Communication University of Reading. Facsimile reprint of the 1937 English edition, with a German translation by Marie Neurath.
- Papanek, V. (1971, 2006). Design for the real world: Human Ecology and Social Change. London: Thames & Hudson.
- Tawlar, S. (2007). Accessing traumatic memory through art making: An art therapy trauma protocol (ATTP). The Arts in Psychotherapy s. 26 Chicago: School of the Art Institute of Chicago
- Tiller, T. (ed). (2011, 2014.) Aksjonsforskning i skole og utdanning. Kristiansand: Norwegian Academic press
- Torgny, K. & Kristensen, K. Vad tror du att bilden betyder? Ett test av 29 nya pictobilder för att tala om våld. Bräcke Diakoni, 2012, p.8
- Widerberg, K. (2010). Metodene våre. Eksempler fra samfunnsvitenskapelig forskning. Album D., Hansen N. M.and Widerberg. K. (ed.). Oslo: Universitetsforlaget, p.219-234.